Rochester area doesn’t NEED CapX
Remember all the hype about Rochester, home of the Mayo Clinic, freezing in the dark on a respirator without a job?
A little birdie sent me this:
Rochester Public Utilities 2009 Electric System Engineering & Operations Report
On p. 18 there’s some important info. First, the number of customers has increased slightly:
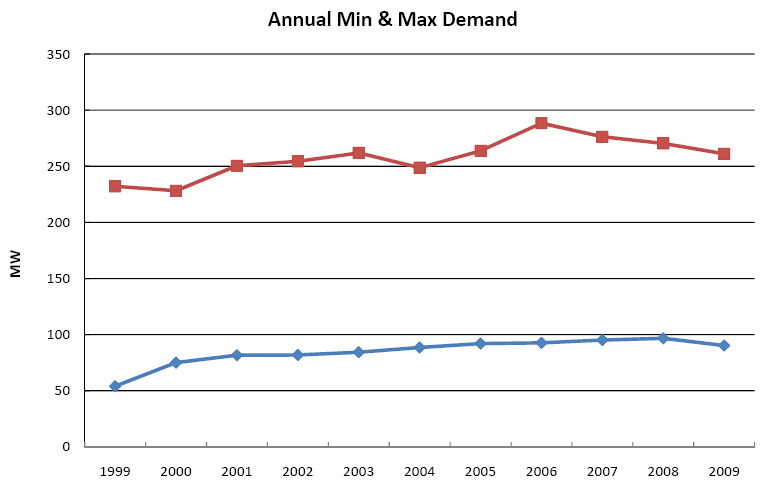
And note that RPU’s peak demand was also in 2006 (I wish they’d go back a lot further):
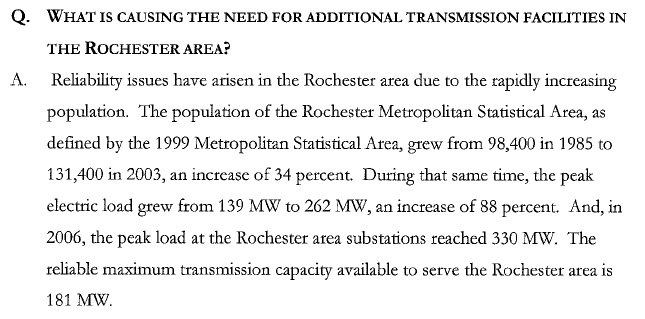
From the CapX CoN docket, here’s testimony from Amanda King:
Here are the Rochester load specifics in chart form, substation by substation:
Here it is as Application, Appendix C-1, just slightly different:
Application-AppC-1_Map-of-Rochester-Area-Summer-Peak-Load-Information_2002-2020
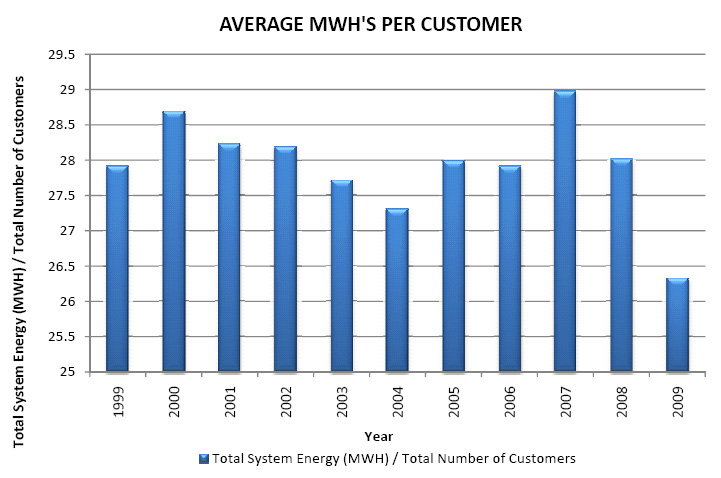
Now look at this – the average MWH/customer:
 Here’s some interesting information – their SAIDI, SAIFI and CAIDI reports — what changed in 2002 that dramatically altered the SAIDI statistics going forward:
And the chart that says it all:
All in all, a very interesting report, clear, easy for non-wonks to understand, it’s got a good beat and you can dance to it, I’ll give it a 98!


Comments
Rochester area doesn’t NEED CapX — No Comments
HTML tags allowed in your comment: <a href="" title=""> <abbr title=""> <acronym title=""> <b> <blockquote cite=""> <cite> <code> <del datetime=""> <em> <i> <q cite=""> <s> <strike> <strong>