Lies, more lies… RPU demand forecast released
Utilities’ demand forecasts are getting closer to the truth, exposing the CapX 2020 demand forecast lies.
An example in point, from RPU’s blog post:
Draft Infrastructure Plan Update presented at the July 28th Board Meeting
Color me PISSED OFF!!! Yes, I know, it’s nothing new, but I really hate it when these lies of “increasing demand” are conveniently exposed in new “updated” forecasts — after the PUC denies multiple Motions for Reconsideration regarding decreased demand. CapX 2020 depends on a three part claim of need, and claimed that Rochester had an URGENT need for electricity due to increasing demand and they needed CapX 2020 to get enough juice in the area. Yes, DUH, we know that is not true. We know the forecasts are inflated. The CapX 2020 record already reflects that the claimed Rochester local demand was utter bullshit, that the claim did not take the new 161kV lines into consideration, that the claim did not take the planned 100MW “West Side” gas plant into consideration, and that the forecasts were overestimated…
And folks, here’s the proof, straight from the horse’s… errrr… mouth, yeah, that’s it:
Rochester Public Utilities 2009 Infrastructure Update (using 2006 data)
Click here for RPU’s page with its forecasting and planning reports.
And I’ve heard that Comments will be taken on this, now’s your chance — I’ll post an email to send Comments to soon:
Tony Benson Infrastructure Planning Comment Rochester Public Utilities
4000 East River Road N.E. Rochester, MNÂ 55906 or email to: tbenson@rpu.org
Here’s the old report — we’ll be comparing:
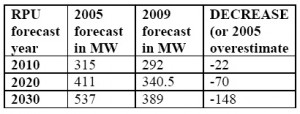
And why am I so pissed off, you may ask?
It’s simple. Here’s a little chart to elucidate:
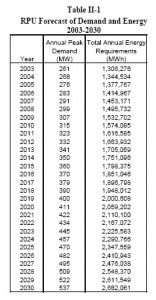
And where did these numbers come from? From these charts in the RPU reports! First, the 2005 RPU Report:
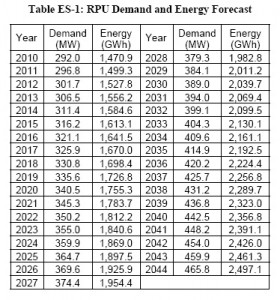
 And for comparison, the 2009 RPU Report just released:
Thanks to a little birdie, I have another cute little chart from RPU’s annual report:
 Note the 30+% decrease in Wholesale Sales? Note the decreasing demand since 2007? Sound familiar?
There’s even more in the 2009 MAPP Load & Capability Report. In the MAPP L&C, check out the RPU pages starting on p. II-307, and see if that makes any sense to you. It shows a lot lower demand numbers, it shows sales, but it doesn’t show purchases, and the numbers don’t add up to those in their own reports. Their demand is mixed in with other nearby utilities and that must be where it is, but you’d think it would show up in purchases or sales…
So, looking at the new RPU report, yup, Rochester sure needs CapX 2020’s bundled and “double circuit ready” 345kV transmission line, eh?
How stupid do they think we are? And of course they wait until our Motions for Reconsideration are rejected to release this information, and remember, it’s old information at that, the 2006 numbers are the last ones before demand started going down, so real forecasts, updated with “2007-present” information, will be a lot lower.
Send your comments to RPU, and I’ll have an email address posted as soon as I can find one:
Tony Benson Infrastructure Planning Comment Rochester Public Utilities
4000 East River Road N.E. Rochester, MNÂ 55906
or email to: tbenson@rpu.org


Good post!
Interesting that Delaware has just passed a law calling for 2 percent annual reductions in energy and “coincident peak” load.
(Minnesota has a 1.5 percent goal but it’s not entirely clear to me what it means and the utilities don’t seem excited about complying with it.)
Point is, all these forecasts upon which CAPx2020 is based look pretty bogus.
Keep up the good work!
am